 PublicSphere Live
Capital Market
NGX ASI Rises 0.13% As Banking Stocks Weigh On Market; Turnover Falls 46%
Equities market closes the week on a cautiously positive note, but declining trading activity, a higher number of losers and divergent sectoral performances reveal an underlying struggle to sustain bullish momentum.
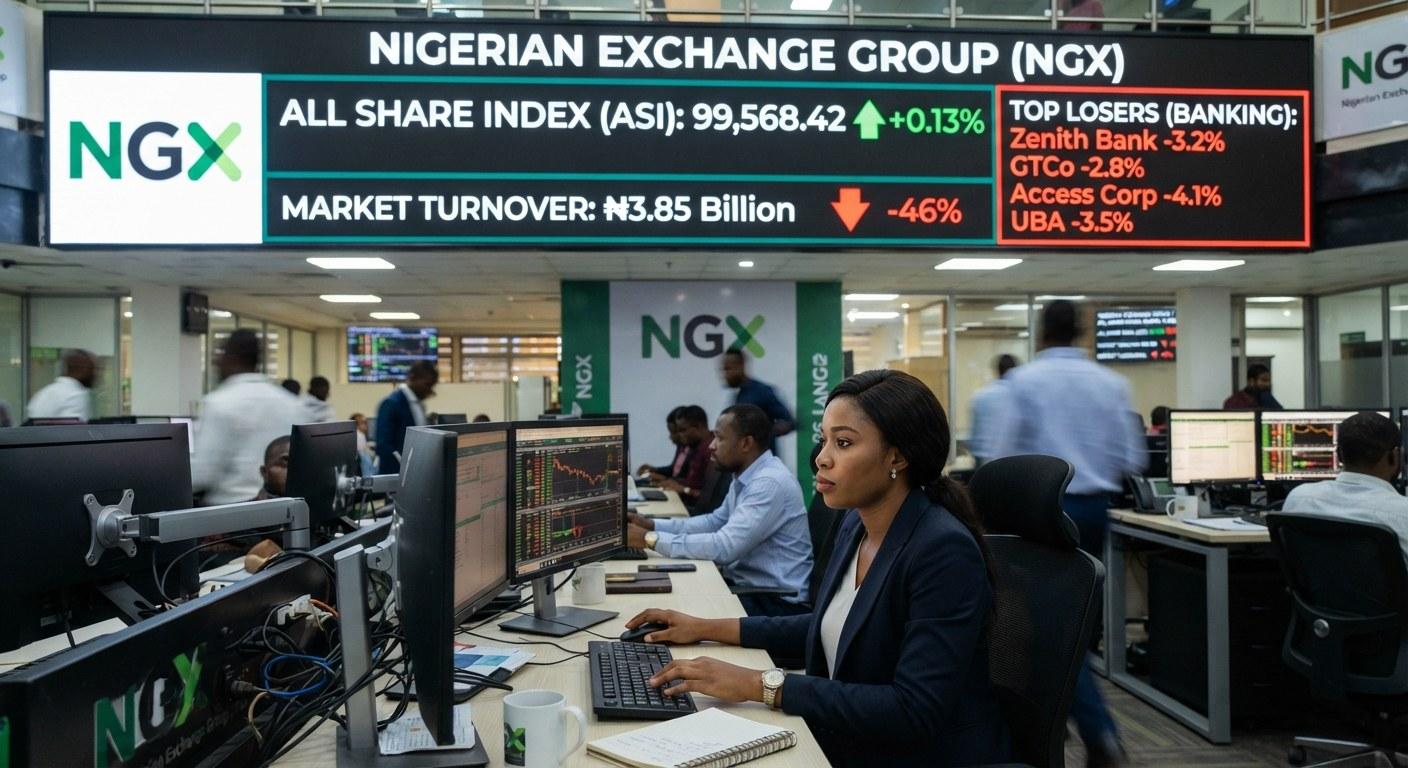
The Nigerian Exchange (NGX) ended trading on Friday, October 9, 2026, with a modest improvement in its benchmark All-Share Index (ASI), offering investors a measure of relief after a difficult week, although the broader trading statistics suggested that the market's recovery remained fragile and unevenly distributed across listed equities.
The ASI gained 321.05 points, representing an increase of 0.13 per cent, to close at 248,363.55 points. The advance prevented the market from finishing the week on a negative note on Friday itself, but it was insufficient to erase the losses recorded during the preceding sessions, leaving the benchmark with a weekly decline of 0.97 per cent.
The contrast between the positive daily performance and the negative weekly result is important in understanding the market's direction. Friday's gain indicated that buying interest had not disappeared, but the accumulated weekly loss suggested that investors were still confronting pressures strong enough to limit the market's ability to sustain a consistent upward trajectory.
Moreover, the modest increase in the ASI occurred alongside a significant contraction in trading activity. Investors exchanged 322,014,816 shares in 37,758 deals, with a combined value of approximately ₦20.49 billion. Compared with Thursday's session, trading volume declined by 35 per cent, turnover fell by 46 per cent, while the number of deals decreased by two per cent.
These figures indicate that the market's Friday advance was accompanied by substantially lower participation in terms of the volume and monetary value of shares traded. Although reduced turnover does not automatically signal weakening confidence, the combination of a modest index gain and a sharp contraction in traded value suggests that the advance should be interpreted cautiously rather than as conclusive evidence of a renewed bullish phase.
The exchange's reported market capitalisation stood at approximately ₦160.8 trillion, equivalent to about $121 billion. The market therefore retained a substantial valuation despite the week's setback, supported by its strong cumulative performance in 2026.
The central question confronting investors is whether Friday's recovery represents the beginning of another upward movement or merely a temporary pause in a market experiencing profit-taking, portfolio repositioning and selective demand for equities.
Market Breadth Favours The Bears Despite AsI's Advance
One of the most revealing features of Friday's trading was the divergence between the benchmark index and the number of equities that advanced or declined.
Of the 131 listed equities that participated in trading, 22 recorded price appreciation, while 31 closed lower. The remaining 78 did not fall into either of these two categories, although the supplied figures do not specify how many were unchanged or how trading was distributed among them.
The 31 decliners outnumbered the 22 advancers by nine stocks, producing a negative balance of nine equities. This suggests that weakness was more widespread than strength among the stocks that experienced price changes, even as the market capitalisation-weighted benchmark moved higher.
That distinction matters because the ASI does not give every listed company equal influence. Its movement reflects the aggregate market value of listed equities, meaning that price changes in large or heavily weighted companies can have a greater effect on the index than gains or losses in smaller stocks.
Consequently, a market can close higher even when more equities decline than advance. Friday's performance illustrates precisely why investors should avoid relying exclusively on the headline ASI when evaluating the condition of the stock market.
The relatively narrow breadth of gains also raises questions about the quality of the recovery. While the benchmark recorded a positive return, investors holding shares in companies that declined could have experienced losses during the same session. The market's overall direction therefore did not necessarily translate into positive returns across individual portfolios.
For investors, the implication is that stock selection remains important. A rising benchmark does not guarantee that every sector or company is participating in the advance, and a market characterised by uneven performance can reward investors who distinguish between companies with sustainable earnings prospects and stocks whose movements are driven largely by short-term trading sentiment.
Despite the weekly setback, the broader performance of Nigerian equities in 2026 remains impressive. The ASI's year-to-date appreciation of 59.6 per cent indicates that the market has generated substantial capital gains for investors who entered positions before the current level, although the actual returns of individual investors depend on their entry prices, portfolio composition, transaction costs and dividends received.
NGX at a glance
ASI closing level
248,363.55
+0.13% daily
Year-to-date return
+59.60%
Strong cumulative gain
Market turnover
₦20.49bn
−46% daily
Market breadth
22 : 31
Gainers versus losers
Source: Trading summary supplied for Friday, October 9, 2026. Figures reflect the reported session.
However, a strong year-to-date return should not be confused with an assurance of further appreciation. A market that has advanced substantially may attract profit-taking as investors seek to lock in gains, particularly when valuations have risen faster than the earnings of some listed companies.
The immediate challenge for the NGX is therefore to convert its accumulated gains into a more stable upward trend, supported by corporate earnings, dividend expectations, improved liquidity and confidence in the Nigerian economy.
Sectoral Performance: Oil And Gas, Consumer Goods And Industrials
The Sectoral Figures Supplied for Friday show a mixed but generally positive performance among the three reported sector indices, with oil and gas and consumer goods each advancing by 0.16 per cent, while industrial equities gained a marginal 0.02 per cent.
The different year-to-date returns, however, reveal substantial disparities in the market's performance across sectors.
Reported sector and market index performance
Daily change on Friday, October 9, 2026
NGX Premium Index
+0.50%
YTD +102.66%
Weekly: -0.64%
NGX Oil & Gas Index
+0.16%
YTD +124.92%
Weekly: -3.85%
NGX Consumer Goods Index
+0.16%
YTD +1.46%
Weekly: -0.58%
NGX Industrial Index
+0.02%
YTD +83.96%
Weekly: +0.02%
NGX Top 30 Index
+0.15%
YTD +61.10%
Weekly: -0.99%
NGX Main Board Index
-0.11%
YTD +42.79%
Weekly: -1.20%
The bar represents the absolute daily percentage change, scaled to a maximum of 0.50%; it is not a measure of market capitalisation or trading volume.
Oil And Gas: The Year's Strongest Reported Sector
The NGX Oil and Gas Index advanced by 0.16 per cent on Friday, offering a modest recovery after a difficult week in which it lost 3.85 per cent. Nevertheless, the sector's year-to-date appreciation of 124.92 per cent makes it the strongest performer among the reported indices.
This is a striking performance, suggesting that oil and gas equities have been among the principal beneficiaries of the market's 2026 rally. Yet the contrast between the sector's cumulative gains and its weekly decline is equally significant: the sector has enjoyed substantial appreciation, but recent selling pressure shows that investors are not uniformly prepared to maintain their exposure at prevailing prices.
The sector's longer-term prospects depend on more than the direction of crude oil prices. Investors must also assess production volumes, operating costs, foreign-exchange exposure, debt obligations, refining and distribution economics, and the capacity of individual companies to translate revenue growth into earnings and cash flow.
For oil and gas stocks that have appreciated sharply, valuation discipline becomes particularly important. Strong historical performance can attract further demand, but it can also encourage profit-taking where investors believe prices have moved ahead of fundamentals.
The Friday gain is therefore encouraging, but the weekly decline means the sector has yet to demonstrate a convincing recovery from its recent weakness.
Consumer Goods: A Small Daily Recovery, But Limited Year-To-Date Growth
The NGX Consumer Goods Index also gained 0.16 per cent, ending the session on a positive note after losing 0.58 per cent over the week. Its year-to-date return, however, stood at just 1.46 per cent, substantially below the returns recorded by the oil and gas and industrial indices.
This divergence is important because consumer goods companies occupy a central position in the real economy. Their performance is influenced by household purchasing power, inflation, production costs, the availability of foreign exchange, borrowing costs and the ability of manufacturers to pass rising expenses on to consumers.
When household incomes are under pressure, consumers may reduce spending, trade down to cheaper products or postpone purchases. Manufacturers can respond by raising prices, but repeated price increases may weaken demand, particularly where competing products are available at lower prices.
Companies that depend heavily on imported raw materials or packaging may also face currency-related costs, while businesses with strong local sourcing, efficient distribution networks and recognisable brands may be better positioned to withstand difficult conditions.
The sector's modest year-to-date appreciation suggests that the broad market rally has not translated into comparable gains for consumer goods equities. Friday's advance may signal selective buying, but investors will need stronger evidence of improved margins, sales volumes and earnings growth before concluding that the sector is entering a sustained recovery.
Industrials: Strong Cumulative Performance, Little Movement On Friday
The NGX Industrial Index rose by just 0.02 per cent on Friday, making it virtually flat for the session. Its weekly performance was also positive at 0.02 per cent, while its year-to-date appreciation reached 83.96 per cent.
The sector's substantial annual return suggests that industrial equities have participated meaningfully in the market's broader advance. Yet the negligible daily movement indicates that buying and selling were relatively balanced at the index level.
Industrial companies, including cement manufacturers and other major producers, are particularly sensitive to energy costs, logistics, infrastructure constraints, interest rates, exchange-rate movements and demand for construction materials and manufactured products.
Companies with pricing power, efficient operations and sufficient capacity to meet demand may be able to preserve margins even in a challenging business environment. Conversely, high financing costs, expensive energy and weak demand can limit the conversion of higher revenue into stronger profits.
The industrial index's 83.96 per cent year-to-date gain provides evidence of substantial market appreciation, but investors should distinguish between price momentum and the underlying capacity of individual businesses to sustain earnings growth.
The sector's near-flat Friday performance is not inherently bearish. It may reflect consolidation after earlier advances, but subsequent sessions will determine whether industrial equities resume their upward movement or experience more extensive profit-taking.
Premium, Top 30 And Main Board: Blue-Chip Resilience Meets Selective Selling
Premium Index: The Day's Strongest Reported Index
The NGX Premium Index gained 0.50 per cent on Friday, outperforming the other indices listed in the supplied report. Its weekly loss narrowed to 0.64 per cent, while its year-to-date appreciation stood at 102.66 per cent.
The Premium Index's strong annual return points to substantial appreciation among its constituent equities. Its comparatively stronger Friday performance may indicate renewed demand for selected large or prominent listed companies, although the index's movement alone does not establish that all premium-board stocks attracted fresh buying.
For investors, the Premium Index is useful as a gauge of selected prominent companies, but its daily performance must be considered alongside the underlying share prices, earnings announcements and trading volumes of its constituents. A strong index can conceal weakness in individual stocks, just as a weak index can obscure opportunities in companies with improving fundamentals.
Its weekly decline also suggests that Friday's advance has not yet fully reversed the recent selling pressure.
NGX Top 30: Large-Company Shares Recover Marginally
The NGX Top 30 Index appreciated by 0.15 per cent on Friday, outperforming the ASI's 0.13 per cent gain by a narrow margin. However, it recorded a weekly loss of 0.99 per cent, slightly worse than the benchmark's 0.97 per cent decline.
Its year-to-date return of 61.1 per cent remains impressive and marginally exceeds the ASI's 59.6 per cent appreciation.
The index's performance indicates that selected large-capitalisation equities have delivered substantial returns over the year, even as recent sessions have introduced renewed volatility. The marginal outperformance on Friday may suggest some resilience among its constituents, but the negative weekly return cautions against interpreting the advance as a decisive turnaround.
Investors tracking large-cap equities should pay attention to the relationship between market prices and earnings growth, dividend prospects, capital expenditure and balance-sheet strength. Size and liquidity can make a company attractive, but neither guarantees that its shares are trading at an appropriate valuation.
Main Board: The Only Declining Index Among Those Reported
The NGX Main Board Index fell by 0.11 per cent on Friday, making it the only index in the supplied list to finish the session lower.
Its weekly decline of 1.20 per cent was also the steepest among the six indices for which daily and weekly comparisons were provided. Despite this weakness, the index remained up 42.79 per cent year to date.
The Main Board's underperformance is a reminder that the market's gains have not been uniform. While the broader ASI advanced, the Main Board's negative close suggests that weakness in some of its constituents continued to outweigh positive movements elsewhere within that index.
The implication is not necessarily that Main Board stocks are uniformly unattractive, but that investors need to investigate the specific companies responsible for the index's movement. Earnings quality, debt exposure, dividend history, liquidity and valuation can differ substantially among listed businesses.
Other Benchmarks: Industrials Hold, Consumer Goods Edge Higher
The remaining reported index performances reinforce the mixed character of Friday's market.
Index
Daily change
Weekly change
Year-to-date
NGX All-Share Index
+0.13%
-0.97%
+59.60%
NGX Top 30 Index
+0.15%
-0.99%
+61.10%
NGX Premium Index
+0.50%
-0.64%
+102.66%
NGX Oil & Gas Index
+0.16%
-3.85%
+124.92%
NGX Consumer Goods Index
+0.16%
-0.58%
+1.46%
NGX Industrial Index
+0.02%
+0.02%
+83.96%
NGX Main Board Index
-0.11%
-1.20%
+42.79%
The table makes two important points. First, the industrial index was the only one of these seven indices to record a positive weekly return, albeit a marginal one. Second, the oil and gas and Premium indices recorded the largest year-to-date gains, but their recent weekly declines illustrate how a strong longer-term rally can coexist with short-term selling pressure.
A qualification on sector coverage: the supplied Friday summary does not provide the daily, weekly or year-to-date figures for the NGX Banking Index and NGX Insurance Index, nor does it provide every other specialised index tracked by the exchange. Their exact Friday performances cannot therefore be established from the supplied figures, and it would be misleading to invent them. The Consumer Goods, Industrial and Oil & Gas indices are the three conventional sector indices for which this report provides Friday's figures.
Stock Picking: Regency Alliance Leads Gainers As Fidelity Bank Slides
Individual stock performances further demonstrate the divergence beneath the benchmark's modest advance.
Top gainers
Closing price appreciation
Regency Alliance Insurance
+10.00%
₦0.77
Livestock Feeds
+9.58%
Guinea Insurance
+9.41%
CAP Plc
+8.50%
Top losers
Closing price depreciation
Red Star Express
-9.76%
₦13.40
Fidelity Bank
-8.70%
DAAR Communications
-8.00%
Coronation Insurance
-7.26%
Regency Alliance Insurance's 10 per cent appreciation placed it at the top of the day's gainers, followed by Livestock Feeds, Guinea Insurance and CAP Plc. Their performances demonstrate that investors continued to identify opportunities in individual stocks despite the broader market's uneven breadth.
On the losing side, Red Star Express shed 9.76 per cent, while Fidelity Bank declined by 8.70 per cent. DAAR Communications and Coronation Insurance also suffered substantial price depreciation.
Fidelity Bank's position among the leading decliners is particularly noteworthy because banking equities are important components of the Nigerian market's investment universe. Nevertheless, a single day's decline does not establish a bank's financial condition or the direction of its longer-term share price. Investors should examine the company's earnings, asset quality, capital position, dividend prospects and any relevant corporate disclosures before deciding whether the fall presents a buying opportunity.
Similarly, sharp gains in smaller stocks should not automatically be interpreted as evidence of improving business fundamentals. Where prices move substantially in one session, investors need to distinguish between a sustained improvement in demand and temporary speculative activity.
The day's price movements therefore reinforce the importance of company-level analysis rather than indiscriminate buying based solely on the market's positive close.
Banks Dominate Trading Volume
Zenith Bank recorded the highest trading volume, with 31.7 million shares changing hands. Guaranty Trust Holding Company followed with 23.5 million shares, Access Holdings recorded 19.2 million shares, while Fidelity Bank traded 17.5 million shares.
Together, these four banking stocks accounted for approximately 91.9 million shares, or 28.5 per cent of the day's total volume of 322.0 million shares.
Share
Chart options
Most actively traded shares
Reported trading volumes for the four most active stocks on Friday, October 9, 2026.
The concentration of trading activity in banking shares suggests that financial stocks remained central to investors' daily transactions, even though Fidelity Bank experienced one of the steepest price declines.
High trading volume, however, should not be confused with positive price momentum. A stock can record heavy turnover because buyers and sellers are actively adjusting their positions, with the closing price ultimately determined by the balance between demand and supply.
The 35 per cent contraction in total market volume and 46 per cent decline in turnover also suggest that Friday's overall activity was considerably lower than Thursday's. The smaller decline in deals, at two per cent, indicates that the number of transactions remained relatively close to the previous session's level even as the quantity and value of shares exchanged fell sharply.
This combination may indicate that transactions were, on average, smaller in volume or value, although the aggregate figures alone cannot establish why investors traded less.
What Investors Should Watch Next Week
As the market enters the new trading week, the central issue will be whether Friday's advance can develop into a sustained recovery or whether the recent weekly losses will continue to weigh on sentiment.
Three factors deserve particular attention.
First, market breadth will help determine the quality of any further advance. If the ASI rises while decliners continue to outnumber advancers, the recovery may remain concentrated in a relatively small group of equities. A broader advance, supported by improving participation across sectors and companies, would provide stronger evidence of renewed confidence.
Second, trading activity will be important. A recovery accompanied by increasing turnover and rising prices across a wider range of stocks would generally provide stronger confirmation of buying interest than a marginal index gain recorded on sharply lower turnover. Nevertheless, turnover must be interpreted alongside price movements, since heavy trading can also accompany intensified selling.
Third, investors should monitor company earnings, corporate announcements, dividend expectations and macroeconomic developments affecting inflation, interest rates, exchange rates and business costs. These fundamentals will help determine whether current valuations are justified and whether the market's strong year-to-date gains can be sustained.
Investors should also avoid assuming that the year's strongest-performing sectors will necessarily remain the best performers. Oil and gas equities have delivered exceptional gains, but their recent weekly decline illustrates the possibility of corrections after substantial appreciation. Meanwhile, consumer goods stocks have lagged considerably on a year-to-date basis, but that underperformance alone does not guarantee a rebound.
The more prudent approach is to evaluate each company's financial prospects, valuation and ability to generate sustainable returns rather than buying or selling solely in response to short-term market movements.
Conclusion: A Modest Rebound, Not Yet A Confirmed Recovery
Friday's trading session presented two contrasting pictures of the Nigerian equities market. The ASI gained 0.13 per cent, the Premium Index advanced 0.50 per cent, and the oil and gas and consumer goods indices each rose 0.16 per cent. The market nevertheless recorded more losers than gainers, turnover contracted sharply, and the benchmark ended the week 0.97 per cent lower.
The industrial index's marginal weekly gain offered a limited bright spot, while the Main Board's 1.20 per cent weekly decline and the oil and gas index's 3.85 per cent loss highlighted continuing differences in sectoral performance.
Yet the market's year-to-date record remains strong, with the ASI up 59.6 per cent, the Premium Index up 102.66 per cent and the Oil & Gas Index up 124.92 per cent.
The conclusion is that Nigerian equities retain substantial cumulative gains, but short-term momentum remains uncertain. Friday's improvement is welcome, although it does not yet establish that the market has decisively overcome its recent weakness.
The outlook for the coming week is cautiously mixed: a sustained recovery would require stronger market breadth, more convincing trading activity and continued support from fundamentally sound equities. Until those signals emerge, investors would be better served by disciplined stock selection and careful risk management than by assuming that one positive session marks the return of an uninterrupted rally.
Most actively traded shares
Reported trading volumes for the four most active stocks on Friday, October 9, 2026.
stock
volume
Zenith Bank
31.7
GTCO
23.5
Access Holdings
19.2
Fidelity Bank
17.5